Source: The Economic Survey of Nagaland 2015-2016, Department of Economics and Statisticsf, Government of Nagaland
Morung Express Feature
Nagaland is primarily an agrarian economy with more than 60 percent of the population dependent on agriculture for their livelihood.
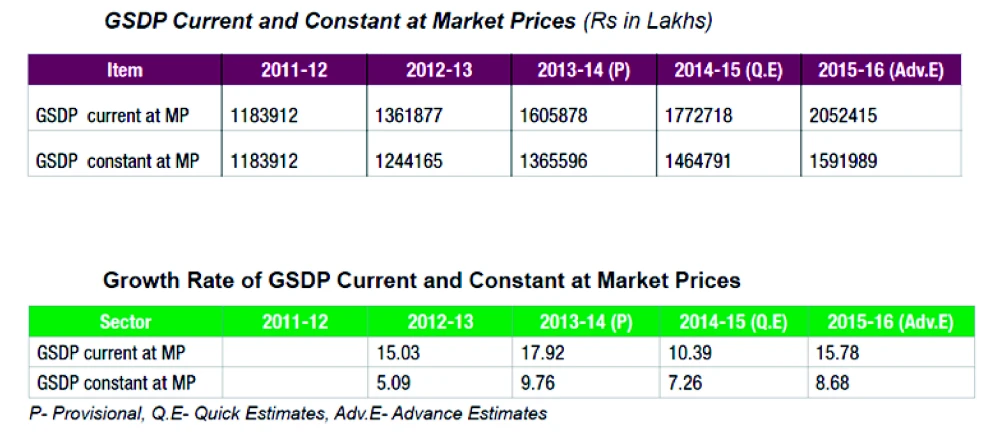
As per the Advance Estimates of 2015-16, GSDP at constant prices registered a growth of 8.68 per cent. In absolute figures, the GSDP at constant prices increased from Rs.1464791 lakhs in 2014-15(Q.E) to Rs.1591989 lakhs in 2015 16(Adv.E).
During the same period, the GSDP at current prices increased from Rs.1772718 lakhs in 2014-15(Q.E) to Rs.2052415 lakhs in 2015-16 (Adv.E).
The Gross State Domestic Product (GSDP) is defined as the total value of all goods and services produced within the State in a year . It is one of the indicators broadly used to study the progress and growth of the economy and portray the sectoral composition and its contribution to the total economy. It has two components:
GSDP at Market Prices (or Current Price) is the GSDP at basic prices plus taxes on products minus the subsidies on products.
Correspondingly, GSDP at Factor Cost (constant) is arrived at by deducting taxes on product from GSDP at basic prices and adding subsidies on products.
Sectoral Composition to GSDP
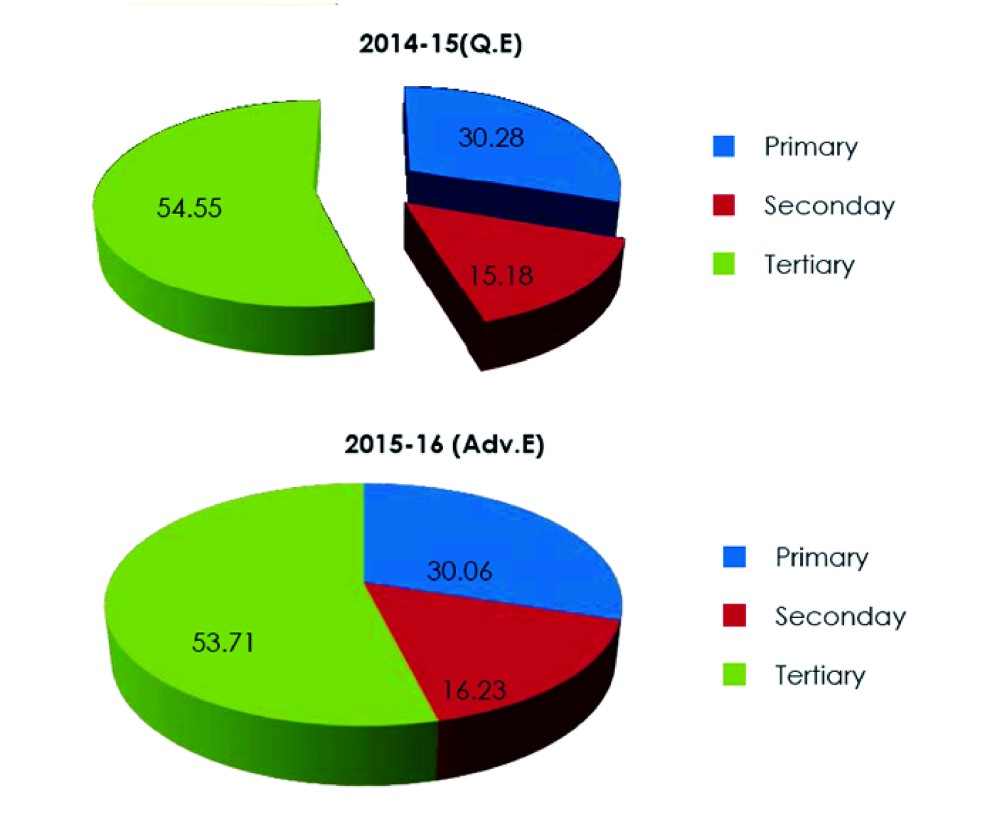
In the estimation of GSDP, the economy of the State is divided into three sectors viz primary sector, secondary sector and tertiary sector.
PRIMARY SECTOR: The primary sector includes Crops, Livestock, Forestry & Logging and Mining & Quarrying. The primary sector is generally dominant in less developed states/ countries. These activities are carried to a smaller extent in industrialized states.
As per the advance estimates of GSDP constant prices, the primary sector is estimated to grow at 7.74 per cent in 2015-16 (A.E) contributing 30.06 per cent to the GSDP in 2015-16 (A.E). Within the primary sector, agriculture proper i.e., Crops, Livestock, Forestry & Logging achieved a growth rate of 7.83 per cent in 2015-16 (A.E) and contributed 29.74 per cent to the GSDP with crops contributing 20.44 per cent.
The share of the other sub-sectors in the primary sector i.e. Mining and Quarrying remained insignificant at 0.32 per cent. In the primary sector Agriculture is the major contributor to the GSDP.
SECONDARY SECTOR The secondary sector comprises of Manufacturing (Registered and Unregistered), Electricity, Gas, Water Supply & Other Utility Services and Construction. The output of the primary sector is generally taken to manufacture finished goods.
As per the Advance Estimates of GSDP at constant prices for 2015-16, the sector registered a growth of 16.04 per cent in 2015-16 and its share in GSDP was 16.23 per cent in 2015-16.
Within the secondary sector, while the share of Electricity, Gas, Water Supply and Other Utility Services ranged between 2 to 2.5 per cent with a declining trend since 2011-12, the share of Construction in the GSDP increased from 11.78 per cent in 2014-15 (Q.E) to 12.98 per cent in 2015-16 (Adv.E). The share of Manufacturing in the GSDP also marginally increased from 1.33 per cent in 2014-15(Q.E) to 1.34 per cent in 2015-16(Adv.E).
TERTIARY SECTOR The Tertiary Sector which comprises of Services activities like Transport, Storage and Communication, Trade, Repairs, hotels and Restaurants; Financial Services, Public Administration, Real Estate & Ownership of Dwelling As per the Advance Estimate of GSDP constant at Basic Prices, the Tertiary sector has registered a fall in growth from 7.53 per cent in 2014-15 (Q.E) to 6.82 per cent in 2015-16 (Adv.E).
Corresponding to the fall in growth rate, the share of the Tertiary sector in GSDP has also declined from 54.55 per cent in 2014-15 (Q.E) to 53.71 per cent in 2015-16 (Adv.E).
Within the tertiary Sector, the sub-Sector “Other Services” has become the most prominent sub-Sector with a contributory share of 17.51 per cent in the GSDP followed by “Public Administration” with a share of 10.97 per cent, “Real Estate, Ownership of Dwelling” 10.24 per cent, “Trade, Repairs, hotel & Restaurant” 6.99 per cent, “Transport, storage, Communication & Services related to Broadcasting” 4.42 per cent and “Financial Services” 3.58 per cent respectively.
PER CAPITA INCOME As per the Advance Estimates of GSDP current at Market Prices, the Per Capita GSDP in 2015-16 is estimated to increase by 14.55 per cent thereby raising the PCI from Rs.86264 in 2014-15 (Q.E) to Rs.98816 in 2015-16 (Adv.E). During the same period, the Per Capita Net State Domestic Product current at Market Prices registered a growth of 15.83 per cent in 2015-16 (Adv.E) as against 10.71 per cent achieved in 2014-15 (Q.E). Corresponding to the increased in the growth rate, the PCI NSDP current at Market Prices has also increased from Rs.76679 in 2014-15 (Q.E) to Rs.88818 in 2015-16 (Adv.E).
Glossary: Per Capita Income PCI is an amount of Income which is supposed to be received by each individual in the State if the total amount of State Income is equally distributed among the total Population of the State. Theoretically, PCI can be arrived at by dividing the State Income by Total Population of the State.
Estimates: The GDP estimates are usually based upon the previous data. Similarly provisional estimates are also based upon the previous data. When these data are revised as per the current position, they are called “Revised Estimates”. However, if the revised estimates show the latest short term situation, then they are called “Quick Estimates”. Advance estimates are a kind of “Quick Estimates” which are done ahead of the time.
According to (Farlex Financial Dictionary) while GDP, the first estimate published approximately one month after the end of a quarter includes all information then available, but because relevant information may not be available immediately or may be subject to revision, it is subject to scrutiny and is usually revised in the preliminary estimate and later in the final estimate. As a result, the advance estimate is considered important as a guideline to performance in a quarter, but it is not necessarily the most accurate measure.
(Compiled from: The Economic Survey of Nagaland 2015-2016, Department of Economics and Statisticsf, Government of Nagaland)