(Photo Courtesy: Image by Gerd Altmann from Pixabay | For representational purpose only)
Trinav Talukdar
Data is something special and powerful. When we get our hands on data, it becomes our responsibility to interpret it in a way that does not instigate the wrong implications. The moment we begin to measure something, we inherit the responsibility of interpreting those measurements with great care, because numbers taken in the wrong context can mislead as easily as they can illuminate.
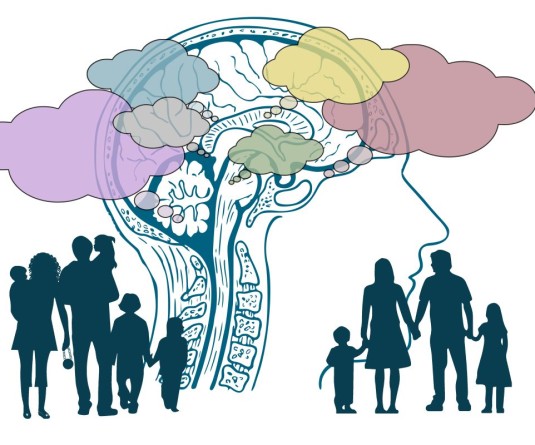
In recent decades, it has been easy to observe that certain things have been on the rise. Things that do not appear ‘normal’ to the average person. From autism diagnoses to reports of vaccine side effects to people identifying themselves as queer, the numbers suggest that these things have become more and more prominent in society over the last few decades. But what exactly do these rising trends indicate? Is it true that a higher percentage of children these days have autism? Is it true that vaccine side effects are very common and something that should deter the public from receiving them? Does a growing portion of the youth population identifying themselves as queer genuinely represent a new surge in queer identities?
These are just a few examples where increasing numbers create the perception of something unusual unfolding, giving rise to unnecessary panic and feeding harmful biases, when it may simply be that we are finally counting what has always been there.
When numbers rise, our first instinct is to assume that the underlying phenomenon itself is increasing. More diagnoses must mean more disease. More reports must mean more danger. More identities must mean more people “becoming” something new. Indeed, this intuition feels natural, obvious even, but it is often wrong. Human experience is not static, but neither does it shift as dramatically or as suddenly as raw statistics sometimes imply. What changes far more quickly is our ability to see. Context gives more meaning to data than the numbers themselves.
Visibility is not a neutral by-product of reality; throughout history, it has been shaped by tools, systems, language, and culture. A condition may exist for centuries, yet only be recognised once diagnostic criteria expand or once stigma declines enough for people to come forward. An identity may be lived quietly across generations, but it only acquires visibility once vocabulary and social acceptance make expression possible. Even side effects or symptoms that once went unreported can suddenly appear “new” once surveillance systems improve.
In other words, increased visibility does not automatically signal increased prevalence. It often reflects shifts in detection, definition, and willingness to be counted. This is the paradox at the heart of interpreting modern data: the more accurately we learn to observe the world, the more it can appear to change, even when it hasn’t changed nearly as much as we think.
History shows how numbers can mislead. Take left-handedness: it once appeared rare, not because it was uncommon, but because social pressure forced many to switch hands. As that stigma faded, the reported rates rose sharply, even though nothing biological had changed. This pattern repeats across contexts. When stigma declines, tools improve, or awareness increases, numbers rise, reflecting greater recognition rather than a true change in human nature.
To get a better grasp on why visibility rises, we need to recognise the fact that measurement itself is a form of technology. It is not a neutral act of “recording facts,” but a process shaped by diagnostic criteria, screening tools, reporting systems, and cultural vocabulary. In some ways, when measurement tools evolve, the population we believe we are observing evolves with them.
For example, the DSM-5 (2013) revised autism criteria by merging earlier diagnoses and broadening behavioural thresholds. Studies show this led to higher recorded prevalence, as individuals who did not meet DSM-IV categories like Asperger’s or PDD-NOS were now included under a unified spectrum. This rise reflects reclassification, not a biological increase.
Similarly, vaccine surveillance expanded sharply with the introduction of digital systems such as VAERS (Vaccine Adverse Event Reporting System; A US national system for collecting reports of possible vaccine side effects) , online submissions and automated EHR (Electronic Health Record; A digital version of a patient’s medical record used by healthcare providers) reporting. After these tools became widely used, the volume of reported minor adverse events increased, even when controlled trials showed stable baseline rates. What changed was reporting efficiency, not the underlying incidence.
Cultural identities follow the same logic through linguistic measurement. When national surveys like the UK Census (2021) and US Household Pulse Survey (2021) formally included nonbinary, pansexual, and asexual categories, the counts of these groups rose immediately. The shift corresponded to the presence of response options, not a demographic explosion in a single year.
In each case, expanded measurement capacity, not a sudden transformation in human traits, drives the visible increase.
Throughout history, institutions have used stigma, punishment, and social pressure to make certain traits disappear or become totally obsolete from public life. Even today, anytime you expose yourself to modern social and political discourse, whether on the internet or in real life, you will see too many instances of people misinterpreting numbers to feed their biases and push narratives that are not based on reality.
As discussed above, left-handedness is a textbook example: early-20th-century schools forcibly trained children out of using their left hand, regardless of whether their left hand was their dominant hand or not. Once these pressures lifted in the mid-century, the numbers “rose,” not because more left-handed people were suddenly born but because the political cost of being visible decreased.
Autism tells a similar story. For decades, diagnostic systems were built around very narrow profiles. Diagnosis was almost exclusively done on typically young, white boys. Autistic girls, adults and minorities went unrecognised. The politics of who is deemed “worth diagnosing” shaped the data far more than underlying biology.
Queer identities show how social structures shape visibility. For much of the 20th century, stigma and criminalisation kept many people silent, leading to artificially low estimates. As acceptance has grown, especially among younger generations, identification has increased—not because sexuality has changed, but because it is safer to acknowledge it.
Even vaccine side-effect reporting is shaped by political and social pressure. Media surges, controversy, and public anxiety can magnify reported symptoms through expectation and heightened scrutiny, as demonstrated in nocebo research. In these cases, what rises is attention, not necessarily danger. Numbers are often misunderstood by sceptics to signal severe biological failure or escalating risk. In reality, the benefits of vaccines still vastly outweigh the very minuscule risks of potential side effects.
If we were to take only one major takeaway from this exploration, it is that increased visibility is often a sign of a healthier, more honest, and more inclusive society, not that the world is suddenly overrun by disorders due to certain modern lifestyle choices. Of course, it is always important to be sceptical, and many times, rising numbers do warrant greater vigilance, but taking numbers out of context to feed biased narratives is an irresponsible act that harms more than it warns. The challenge of our times is not to fear these changes in visibility, but to understand what they actually mean.