Moa Jamir
Dimapur | January 16
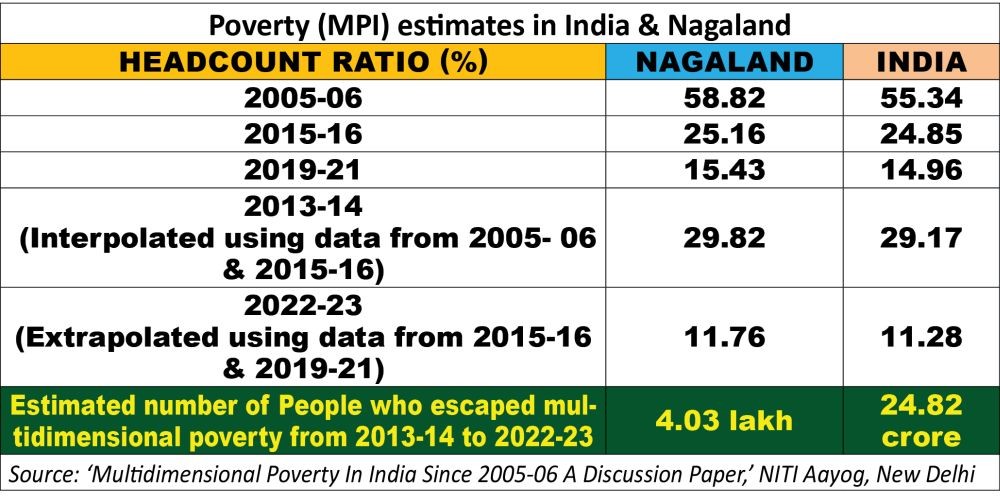
A total of 4.03 lakh people in Nagaland transitioned out of multidimensional poverty (MPI) in the nine years leading up to 2022-23, according to a report released by the NITI Aayog on January 15.
The MPI in India, based on the of Alkire and Foster (AF) methodology, measures simultaneous deprivations using 12 indicators covering three areas - health, education and standard of living.
As per the NITI Aayog’s Discussion Paper ‘Multidimensional Poverty in India since 2005-06,’ the headcount ratio of MPI for Nagaland for 2013-14, based on interpolation of existing data stood, was 29.82% or nearly one-third of the population were in poverty.
However, estimated value based on the existing trend (extrapolation) showed a significant decline in MPI to 11.75% in 2022-23 in Nagaland or a reduction of 18.07 percentage points.
According to the NITI Aayog, Nagaland had 58.82% poverty estimates in 2005-06, which reduced to 25.16% in 2015-16 and 15.43 in 2019-21.
By interpolating data from 2005-06 and 2015-16, the estimated MPI for Nagaland in 2013-14 was 29.82%.
Conversely, the projection for 2022-23 (extrapolation) was derived from the trends observed in 2015-16 and 2019-21.
The three years 2005-06, 2015-16, and 2019-21 estimated using data from the corresponding National Family Health Survey (NFHS) rounds.
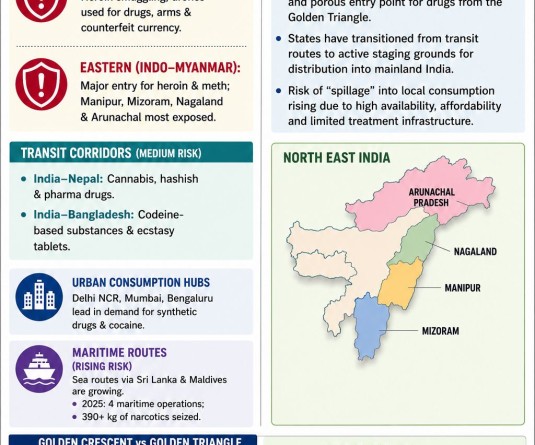
Meanwhile, as per the State-wise Headcount Ratio projection, Nagaland along with the North-East States of Meghalaya, Assam and Tripura were in the top-10 of States or Union Territories with highest MPI.
Nagaland had the seventh highest MPI in India at 11.76, indicating a fall in ranking 2019-21 when the State was placed at tenth.
Overall, the Headcount Ratio of MPI was highest in Bihar at 26.59% followed by Meghalaya (25.46%) and Jharkhand (23.34%) at third.
The rest of the States in top-ten in descending order from fourth to tenth were Uttar Pradesh (17.40), Madhya Pradesh (15.01), Assam (14.47), Nagaland (11.76), Chhattisgarh (11.71), Tripura (11.49), and Odisha (11.07).
At the lower end, the State of Goa had the lowest MPI in India at 0.37%, followed by Kerala (0.48%) and Union Territory (UT) of Puducherry (0.58%).
The other in list of lowest 10 from 4th-10th were Lakshadweep (0.84%), Tamil Nadu (1.43%), A&N Islands (1.63%), Ladakh (1.73%), Sikkim, (2.10%), Chandigarh (2.62%) and Jammu & Kashmir (2.81%).
Steep decline with disclaimer
Meanwhile, across India, a total of 24.82 crore people escaped MPI in last nine years, claimed the NITI Aayog’s giving credit to “significant initiatives of the government to address all dimensions of the poverty between 2013-14 to 2022-23.”.
Accordingly, India registered a significant decline in MPI from 29.17% in 2013-14 to 11.28% in 2022-23 i.e. a reduction of 17.89 percentage points, it said.
It was based on 10.66% decline per year between 2015-16 and 2019-21, the Discussion Paper explained.
The MPI was as high as 55.34% in 2005-06, which declined to 24.85% in 2015-16 and 14.96 in 2019-21.
Uttar Pradesh registered the largest decline in the number of poor with 5.93 crore people escaping MPI, followed by Bihar (3.77 crore), Madhya Pradesh at (2.30 crore), Rajasthan at (1.87 crore) and West Bengal (1.72 crore).
All 12 indicators of MPI have recorded significant improvement during the entire study period and as result, India is likely to achieve its Sustainable Development Goals (SDG)target of halving multidimensional poverty well before 2030, the paper projected optimistically.
Despite claiming a steep decline in the Poverty Headcount Ratio over the last 9 years, the NITI Aayog’s Paper included a significant disclaimer, noting that the reduction in poverty may differ due to various factors and externalities influencing the pace and trajectory of poverty alleviation efforts.
“Since part of the NFHS-5 data were collected before the pandemic, the estimates presented in this paper may not fully reflect the impact of Covid on the economy or the implications of subsequent government,” it added.
What is Multidimensional Poverty Index?
The global Multidimensional Poverty Index (MPI), as per the NITI Aayog, is based on the of Alkire and Foster (AF) methodology that identifies people as “poor or not poor based on a dual-cutoff counting method” and follows the universally acknowledged metric designed to “assess acute poverty, providing a complementary perspective to conventional monetary-based measures of poverty assessment.”
Globally, the MPI uses ten indicators covering three areas namely health, education and standard of living.
Health dimension includes nutrition and child & adolescent mortality indicators, education dimension includes years of schooling and school attendance indicators and standard of living dimension includes 6 household specific indicators namely, housing, household assets, type of cooking fuel, access to sanitation, drinking water and electricity.
In line with the national priorities, the NITI Aayog said, India’s MPI incorporates two additional indicators - maternal health and bank accounts.
Top-ten States/UTS with Highest MPI in 2022-23
State/UTs | *Headcount Ratio (Projected) |
1. Bihar | 26.59 |
2. Meghalaya | 26.59 |
3. Jharkhand | 25.46 |
4. Uttar Pradesh | 23.34 |
5. Madhya Pradesh | 17.40 |
6. Assam | 14.47 |
7. Nagaland | 11.76 |
8. Chhattisgarh | 11.71 |
9. Tripura | 11.49 |
10. Odisha | 11.07 |
*% of population who are multidimensionally poor
Top-ten States/UTS with Lowest MPI in 2022-23
State/UTs | *Headcount Ratio (Projected) |
1. Goa | 0.37 |
2. Kerala | 0.48 |
3. Puducherry | 0.58 |
4. Lakshadweep | 0.84 |
5. Tamil Nadu | 1.43 |
6. A&N Islands | 1.63 |
7. Ladakh | 1.73 |
8. Sikkim | 2.10 |
9. Chandigarh | 2.62 |
10. Jammu & Kashmir | 2.81 |
*% of population who are multidimensionally poor
Source: ‘Multidimensional Poverty In India Since 2005-06 A Discussion Paper,’ NITI Aayog, New Delhi